Loading
SupplySystem IS  SUPPLYSYSTEM IS English
SSIS

SupplySystem Intelligent Software
Put your inventory data to work

SupplySystem Intelligent Software inventory management software seamlessly integrates with your ERP system or can be used as a standalone system, giving you new levels of control, automation, and intelligence. It's intuitive, simple to use, and accessible from any web-enabled device. And because it's a cloud-hosted service, SupplySystem IS requires no on-site servers and very little internal IT involvement.

The new user interface was developed using the modern navigation you are already familiar with in mobile apps and websites. It's easy to learn, faster to find what you are looking for and optimized for use on mobile devices.

Advanced tracking and control

SupplySystem IS gives you up-to-the-minute intelligence so you always know
what you have, where it is, who’s using it, and how they’re using it.


Avoid costly stockouts with real time alerts
Automate your inventory tasks

Automate your inventory tasks

Real-time monitoring makes it easy to manage inventory levels, avoid costly stock-outs,
automate procurement, and reduce admin costs.

Real-time reporting and analytics

SupplySystem IS has over 60 customizable report views so you can filter and sort information, drill down to transaction details, track costs, and gain the insights you need to optimize your inventory.

Information can be aggregated at different levels. For example, distributors can monitor data related to their customers reorder status and inventory turnover, while their customer focuses on local inventory and consumption.


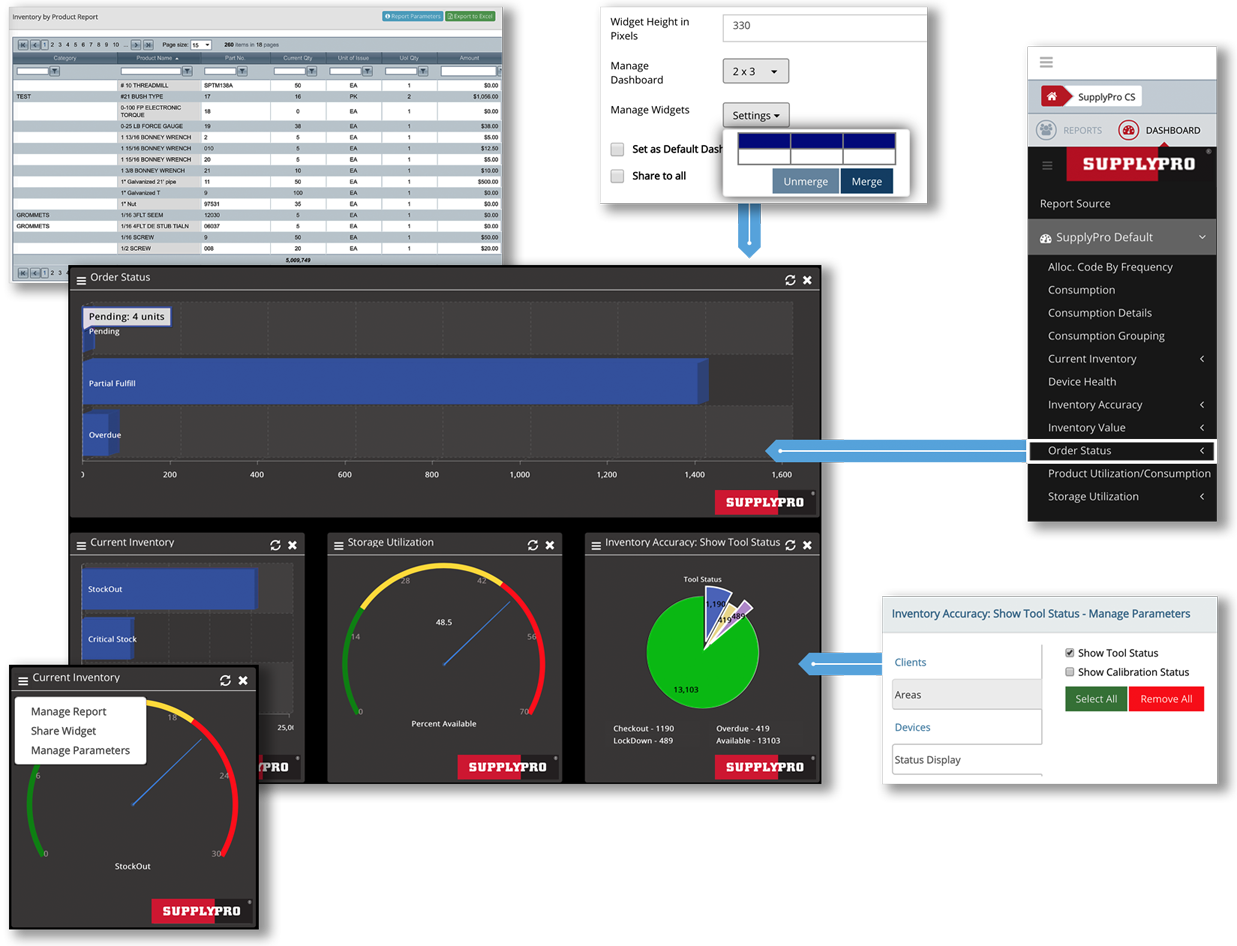
MULTIPLE DRILL-DOWNS TO INDIVIDUAL TRANSACTION DETAILS

GAIN ENTERPRISE-WIDE VISIBILITY AND ANALYTICS FOR LEAN PROCESS

SCHEDULE REPORTS BY DAY, WEEK, MONTH OR QUARTER

SHARE VIA EMAIL OR UPLOAD TO FTP AS EXCEL, XML, OR A FLAT FILE

In addition to the standard reports, the new SupplyInsight dashboard allows users to assemble several elements of their critical data graphically on a screen or on any mobile device. It is simple to use; just drag the data source onto a dashboard and it will generate a widget that can be configured to accurately represent the underlying meaning in the data.
  Identify the data elements you want to visualize
Dashboards

Configure the dashboard
Drag the data source
to the dashboard
Select the data elements for the Widget
Configure how the data is visualized in the Widget